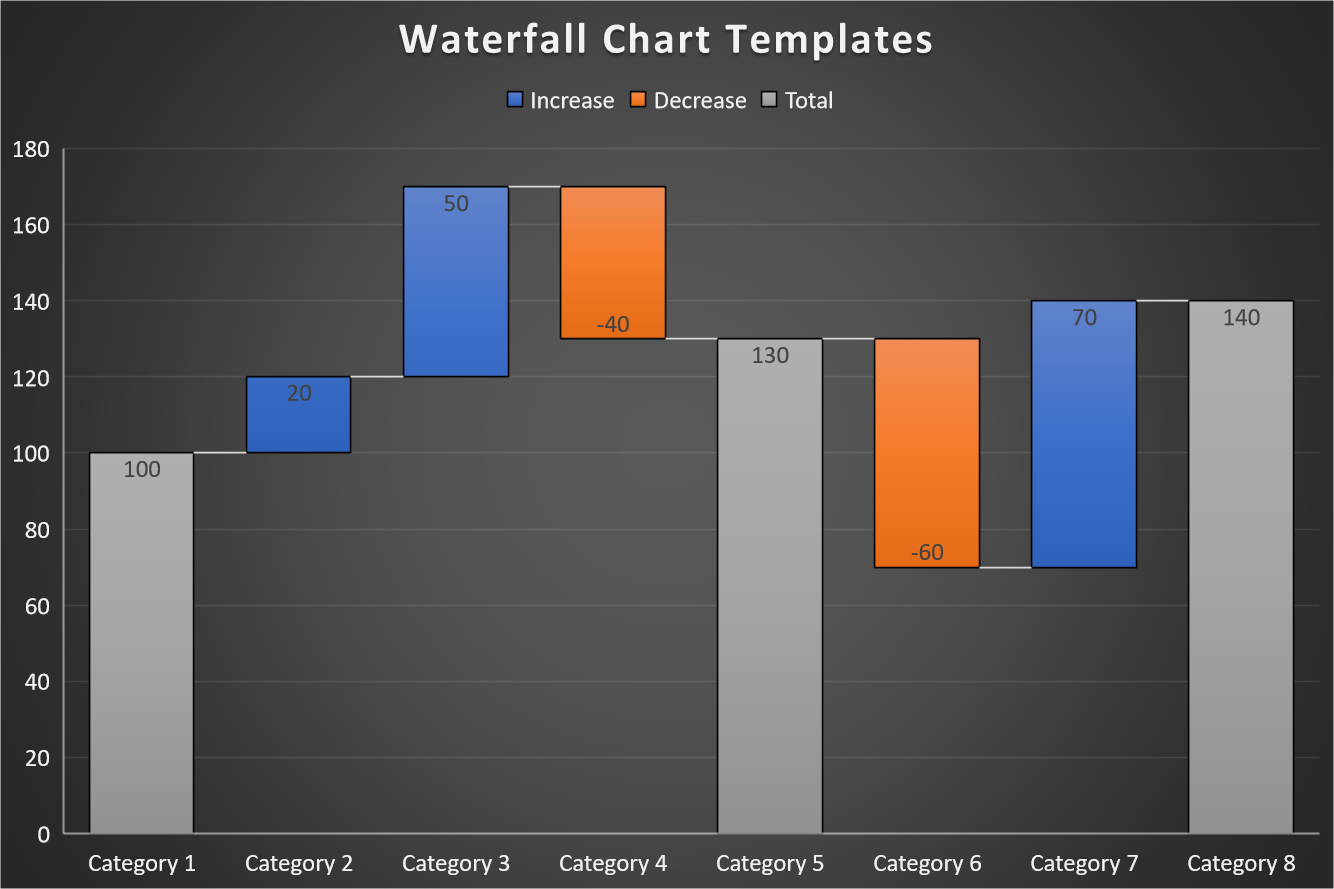
Waterfall Chart Templates (Excel and PowerPoint)
U.S. $10.00 or 10 Credits
Description
Waterfall Chart Templates (Excel and PowerPoint) from Stratrix are editable and customizable templates to create compelling waterfall charts. (Waterfall charts are also known as Cascade graph or Bridge graph.) The goal of these PowerPoint and Excel templates is to help busy executives quickly build compelling charts to explain positive and negative numbers so that they resemble floating steps and make it easy for users to understand the author’s intent.
Waterfall Chart Templates:
Waterfall graphs were an invention of McKinsey consultants to present complex information in a simple and powerful visual metaphor. The waterfall charts templates – in Excel and PowerPoint format – will help users build bridge/cascade charts in a variety of patterns. Waterfall graphs showcase how an initial value increases or decreases by intermediate values, which in turn, results in the final value. The display of all essential values step-by-step with relative quantity easy to see makes the waterfall charts an immensely powerful arsenal in the presenter’s toolkit.
Waterfall charts are valuable in expressing a variety of use cases such as Financial Analysis, Sales patterns, Cost structure, Competitive comparison, Product performance, et al.
Stratrix Waterfall Chart Templates is a set of editable and customizable Waterfall charts in different colors and representing different data. As a user, you can pick any graph format and structure and add your own data to create powerful waterfall graphs and charts.
Stipulations:
- As the Waterfall Chart Templates is a digital product, we do not accept returns, and there are no refunds.
- Product Sales are on an as-is basis and include no warranties.
- We do not provide any customization, implementation help, or product support.
- All sales are subject to our Terms of Service and Privacy Policy.
Waterfall Chart Templates (Excel and PowerPoint)
U.S. $10.00 or 10 Credits


